Setup Datadog logging for .NET8 API
Introduction
Datadog is a monitoring system. Here we will show how you can setup simple logging from your .NET8 application.
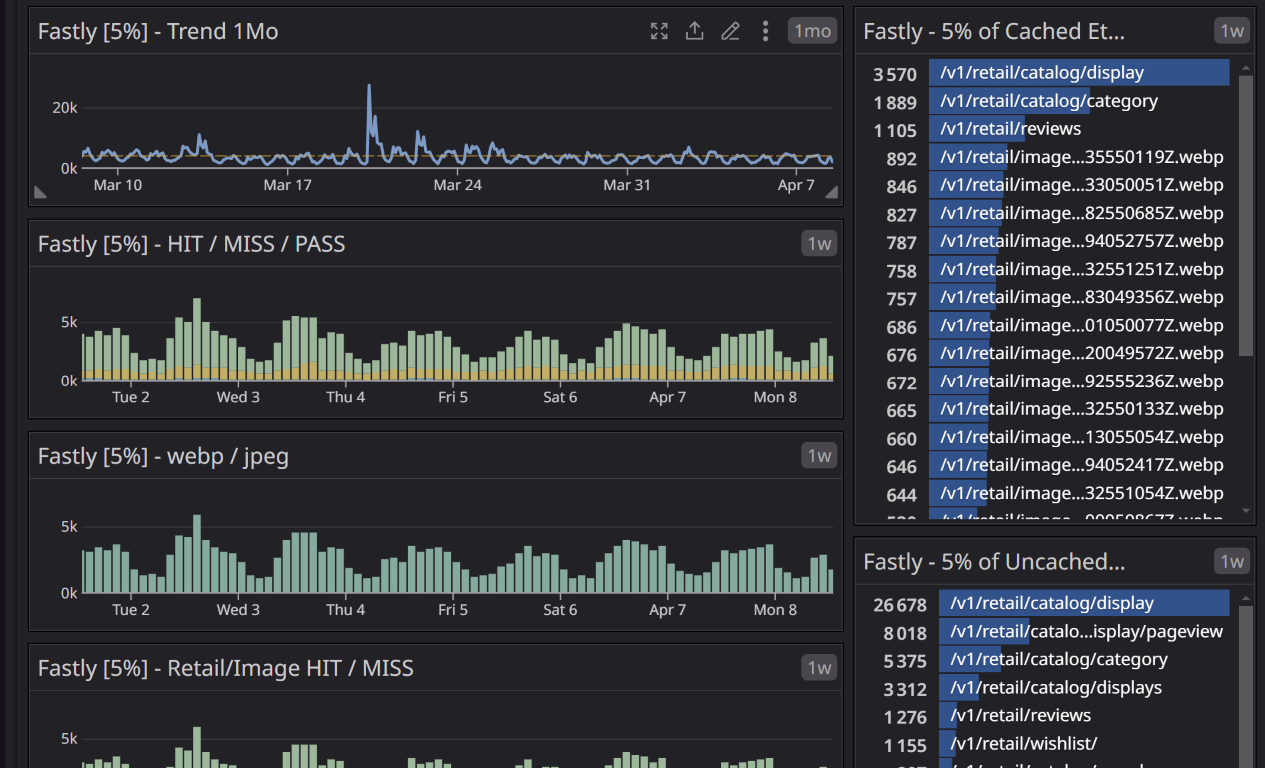
Example on a dashboard

Prerequisites
- Basic knowledge of C# and .NET development.
- A .NET API Project.
- Datadog Account.
Steps
1. Install Serilog nuget packages
The following packages are required fot this setup.
Serilog
Serilog.AspNetCore
Serilog.Sinks.Datadog.Logs
<PackageReference Include="Serilog" Version="3.1.1" />
<PackageReference Include="Serilog.AspNetCore" Version="8.0.1" />
<PackageReference Include="Serilog.Sinks.Datadog.Logs" Version="0.5.2" />
2. Configure your Program.cs
Setup your Program.cs something like this.
The CreateBootstrapLogger method is called to initate a basic console logger before we are done with the Datadog configuration.
We will continue to setup Datadog on the CreateBuilder step.
using Eton.Api.Web.StartupUtils;
using Microsoft.AspNetCore.Builder;
using Serilog;
using System;

try
{
    Log.Logger = new LoggerConfiguration()
        .WriteTo.Console()
        .CreateBootstrapLogger();

    Log.Information($"Starting up: {Environment.MachineName}");

    var builder = WebApplication
        .CreateBuilder(args)
        .ConfigureBuilder();

    var app = builder.Build()
        .ConfigureApplication();

    app.Run();
}
finally
{
    Log.Information($"Shutting down: {Environment.MachineName}");
    Log.CloseAndFlush();
}
3. Configure Serilog and Datadog
In your Builder configuration it should look similar to this.
Here we call ConfigureDatadog.
public static class BuilderSetup
{
    public static WebApplicationBuilder ConfigureBuilder(this WebApplicationBuilder builder)
    {
        builder.Services.AddHealthChecks();
        builder.Services.AddCors();
        builder.Services.AddControllers();
        builder.Services.AddHttpContextAccessor();

        // Must run before things that uses dependency injection
        ConfigureDependencyInjection(builder.Configuration, builder.Services);

        var serviceProvider = builder.Services.BuildServiceProvider();

        ConfigureDatadog(builder, serviceProvider);

        return builder;
    }
}
And the method looks like this:
Where DatadogSettings comes from the dependency injection. So it should be configured before this runs.
The MinimumLevel.Override("Microsoft.AspNetCore", LogEventLevel.Warning) steps can filter out unwanted logs.
So you only send te logs you want to Datadog.
It’s important to have a good system on how you should name and categorize your logs. You have the following fields:
sourceservicehostenv
Decide togheter how to do the naming, everything will be so much more easy to structure in Datadog if the is done properly.
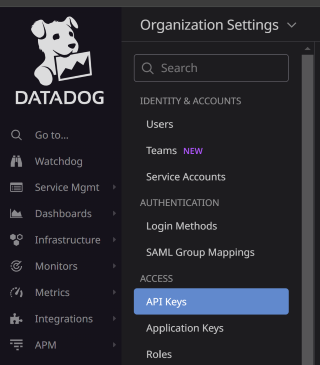
The API keys can you find here in the Datadog portal:

private static void ConfigureDatadog(WebApplicationBuilder builder, IServiceProvider serviceProvider)
{
    var settings = serviceProvider.GetService<IOptions<DatadogSettings>>();

    if (string.IsNullOrEmpty(settings?.Value?.ApiKey))
        throw new MissingFieldException(nameof(DatadogSettings.ApiKey));

    var datadogConfiguration = new DatadogConfiguration()
    {
        Url = "https://http-intake.logs.datadoghq.eu"
    };

    var env = IsDebugMode() ? "debug" : builder.Environment.EnvironmentName.ToLower();

    var enricher = serviceProvider.GetService<CustomLogEnricher>();

    builder.Host.UseSerilog((context, configuration) =>
    {
        configuration
            .MinimumLevel.Information()
            .MinimumLevel.Override("Microsoft.AspNetCore", LogEventLevel.Warning)
            .MinimumLevel.Override("Microsoft.AspNetCore.DataProtection", LogEventLevel.Error)
            .Enrich.FromLogContext()
            .Enrich.With(enricher)
            .WriteTo.DatadogLogs(
                apiKey: settings.Value.ApiKey,
                source: "[source]",
                service: "[service]",
                host: $"{Environment.MachineName}".ToLower(),
                tags: new[] { $"env:{env}" },
                configuration: datadogConfiguration);
    });
}
4. Conclusion
If everything is done correct you should now se logs end up in your Datadog portal under the Logs tab.
This is a very easy way to start monitor your applications. It can then be built out with more nitty gritty stuff.
Like APM metrics and so on.
